How to create a work presentation with AI: draft, edit and export
Turn a checked sales brief into six slides in Ofox Chat, revise one slide, and verify the downloaded PPTX. Includes sample files, prompts and export checks.
 Ofox
To make a useful work presentation with AI, give it checked source material, define the audience and six-slide story, then verify the downloaded file after a targeted revision. A good-looking preview does not establish that the numbers are correct or that the text and chart can be edited.
We used Ofox Chat to turn a small synthetic sales brief into a Japanese presentation, request a change to slide 3, and produce a Russian adaptation. This article is published by Ofox. The example is a teaching exercise, not a customer case or a claim about success rates. The test used the Balanced setting on November 3, 2026; it does not identify a particular underlying model.
The starting PPTX downloaded successfully and opened in WPS Office on macOS. Its title was selectable as a text object; the file contained a native chart and an embedded spreadsheet. That is stronger evidence than the assistant’s description of its output, but it does not prove identical rendering in every version of PowerPoint, Keynote or Google Slides.
Download the worked example
The first run used a Japanese prompt. Later Russian and English files are adaptations in the same conversation, not independent benchmark runs. Japanese original, Japanese revision, Russian revision, and English adaptation are actual Ofox Chat outputs using synthetic data.
The revision check found slide XML for pages 1, 2, 4, 5 and 6 unchanged. The chart values remained 540, 490 and 70 in both Japanese versions and the Russian adaptation. The initial Russian output used 1,100; we requested 1 100 to remove decimal-separator ambiguity before distributing the revised file. These checks apply to these files only.
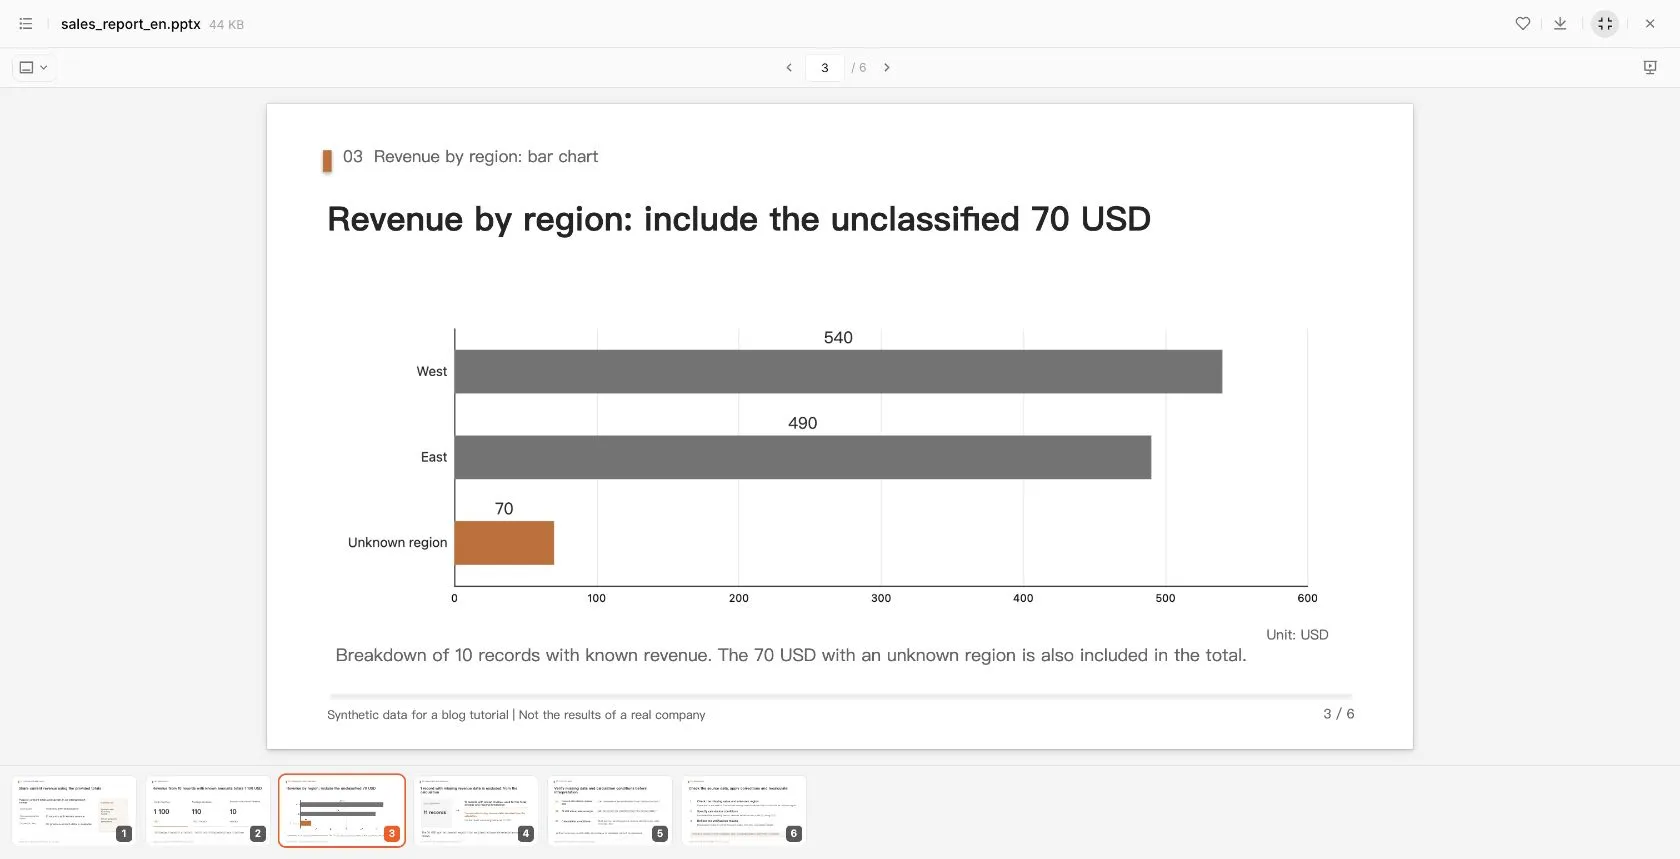
Actual Ofox Chat preview of the English adaptation. It preserves the chart values and the unknown-region category.
Prepare the facts before asking for slides
Start with a brief that a colleague could verify. State the audience, the decision the presentation supports, the source material and the limits of the data. If the source is an unclean spreadsheet, use the Excel analysis workflow first. If it consists of several documents, use the multiple-PDF summary workflow to establish which statements came from which file.
For this example, copy the following source block into the chat. No upload is required to reproduce this short input. For a longer document, attach a file you are authorized to process and ask the assistant to confirm the material it actually read before making the deck.
| Source fact | Value | What the deck may say |
|---|---|---|
| Records after deduplication | 11 | Eleven records remain |
| Records with known sales | 10 | These ten records are the denominator for the average |
| Known sales total | USD 1,100 | Total of known sales, not a complete total including missing revenue |
| Average known sales | USD 110 | 1,100 ÷ 10 |
| East | USD 490 | Regional subtotal |
| West | USD 540 | Regional subtotal |
| Region unknown | USD 70 | Included because its revenue is known |
| Missing revenue | 1 record | Excluded from the sum and average; not treated as zero |
| Previous-period data | Not supplied | No growth rate or trend claim |
Check 490 + 540 + 70 = 1,100 and 1,100 / 10 = 110. The distinction between an unknown region and an unknown amount is essential. Excluding both would understate the known total; treating missing revenue as zero would change the meaning of the average.
The original row-level sample and analysis files are available in the Excel tutorial. Here we deliberately supplied an aggregate brief, so the presentation’s embedded chart workbook contains regional aggregates rather than all transaction rows.
Give the deck a story and a clear output requirement
Open Ofox Chat and select Slides under the composer. In our English interface, this exposed example prompts and template choices. We left the task on Balanced and supplied our own instructions. Sign-in and sufficient account balance are prerequisites; this tutorial does not promise free generation or a fixed cost.
A work presentation needs a purpose beyond filling six pages. Our story is: define the data, show the known result, explain its composition, expose quality limits, list questions, and propose the next checks. It supports an internal review, not a claim that the business is growing.
Use this complete prompt, changing the output language if needed:
Create a six-slide internal sales report in [Japanese/Russian/English].
This is synthetic teaching data, not a real company's results.

Source facts:
11 records after deduplication; 10 have known sales.
Known sales total: USD 1,100. Average: USD 110 per known-sales record.
East: USD 490; West: USD 540; unknown region: USD 70.
One record has missing sales and is excluded from the revenue calculation.
There is no previous-period data.

Slides:
1. Purpose and data scope
2. Key metrics
3. Regional sales bar chart
4. Data quality and exclusions
5. Questions to check
6. Next actions

Use 16:9, a white background, dark text, restrained orange,
a font suitable for the output language and generous whitespace.
Give each slide one main message. Do not invent growth, forecasts,
causes, customers or dates. Keep observations separate from actions.

Consider the outline, then generate the actual presentation file.
Provide a downloadable result and state the available format and
editing limitations. Do not stop at a text outline.
The language variants in this article are reusable templates. The recorded first run used the Japanese version; the Russian deck was requested as a subsequent adaptation in that conversation, not as an independent repeat of the initial test.
Inspect the generated content before polishing it
Our first result was a six-slide sales_report_ja.pptx. It preserved the known-sales denominator, kept the USD 70 with unknown region in the total, and said previous-period comparison was unavailable. It also turned missing inputs into questions rather than filling them with invented values: reporting period, sales definition and currency handling remained to be checked.
Read the outline against the input. Slide 2 should say USD 1,100 across ten known-sales records; slide 4 should explain the excluded record. Slide 3 should include all three regional categories. Slide 6 should propose actions, not claim they have already happened.
Then open the presentation preview and inspect each slide at the size it will be shown. Check whether the title makes one claim, the chart labels have units, the caveat is readable and the reading order is obvious. A decorative graphic is not a substitute for a chart with traceable values. Do not infer a time trend from regional bars.
Keep the first download before requesting changes. A separately named revision makes it possible to compare the two and recover if an unrelated part changes.
Ask for a local change with explicit invariants
“Make it more professional” gives the agent permission to reinterpret too much. Name the slide, the object, the desired change and what must stay fixed. Our revision request highlighted the category that can otherwise disappear from a sales discussion:
Change slide 3 only.
Set its title to: Regional sales: include the USD 70 with unknown region.
Make only the unknown-region bar orange; make East and West gray.
Do not change the other five slides, any values or the chart data.
Save a separate file called sales_report_v2.pptx.
After the revision, compare the other five slides too. An instruction to leave them unchanged is a constraint to verify, not a guarantee. Check the total, average, chart category order and warning about missing data. If the agent changes a source fact while improving the layout, restore the fact and ask for a narrower edit.
For localization, request a full adaptation with unchanged numbers and structure. Spell out that missing values must remain missing and that labels, footnotes and chart categories need translation. Keep the currency as USD unless an explicit, dated conversion is part of the task. Translation must not silently turn a regional label into a country or replace an unknown with a plausible value.
Download and verify the file, not just the preview
Use the Download button on the generated file card. Open the resulting PPTX in the application where you will actually edit or present it. A successful download only proves that a file was delivered.
| Check | How to perform it | What it establishes |
|---|---|---|
| Text object | Select a title or body paragraph | It is not merely baked into a slide-sized image |
| Chart | Select the chart and inspect its data | The categories and values can be checked independently of appearance |
| Fonts | Compare line breaks and labels with the preview | Substitution has not made text overflow or disappear |
| Local revision | Compare the changed slide and the other slides | The requested change did not silently alter unrelated content |
| Presentation mode | View all pages at normal display size | Footnotes, chart labels and sequence remain usable |
The generated file specified Noto Sans CJK JP. A missing font can cause substitution and different wrapping. We opened the Japanese file in WPS and selected its title text; inspection of the PPTX package also found a chart and an embedded XLSX. This establishes the structure of this particular file, not an assurance about every export from Ofox Chat.
Do not describe a deck as fully editable merely because its filename ends in .pptx. Likewise, a PDF is useful for distribution but does not provide the same editing workflow as a presentation file. Only claim a PDF export after actually creating and opening it. Our central deliverable here is PPTX.
Fix the stage that caused the problem
| Symptom | Likely stage to inspect | Practical response |
|---|---|---|
| Only an outline appears | Output request | Ask for the actual file and name the required format; inspect the resulting file card |
| Missing or invented numbers | Source interpretation | Restate the authoritative values, exclusions and unavailable comparisons before touching design |
| Small text or overflowing labels | Slide density and font rendering | Reduce content on the affected slide, shorten the label or choose an available suitable font, then reopen the export |
| A requested single-slide change affects other pages | Revision scope | Return to the saved first version and request one precise change with invariants |
| The preview looks right but the download differs | Export and target application | Compare fonts, charts and object structure in the application used for delivery |
| Translation omits a caveat | Localization | Require all footnotes, uncertainty and source limits to remain; compare against the original |
If generation stops, first check the conversation’s error and whether a file already exists. Repeatedly resubmitting the full task can create duplicate results and additional usage. Save a working download before trying a new variation. Do not upload confidential business material unless your organization’s rules permit that destination.
The useful end point is a deck whose claims match its source and whose downloaded file survives an actual review. Start with the supplied small brief, verify the result, and then repeat the workflow in Ofox Chat using your own approved material.