How to analyze Excel with AI: clean the data, check totals, and build a report
Follow a downloadable 12-row Excel example in Ofox Chat. Find duplicates and missing values, verify the denominator, and check the generated chart and report.
 Ofox

To analyze an Excel file with AI, upload a copy, ask the agent to inventory its worksheets and data problems, agree on cleaning rules, then request the summary and chart. Before using the report, compare the output with the source rows. A plausible graph is not enough: the agent must explain which records it counted and what it left unknown.
This tutorial uses a deliberately imperfect sales workbook in Ofox Chat. It contains a duplicate, a missing region, an unconfirmed amount and a number stored as text. You can reproduce the task and compare your answer with the checks below.
Ofox publishes this guide. The example is synthetic, not a customer case. We ran the workflow in the Japanese interface on November 3, 2026 using the visible Balanced setting. That setting does not identify a fixed underlying model. This small exercise is not a benchmark for large workbooks, macros, external links or every Excel feature.
Start with a workbook you can audit
Download the sample workbook. The Sales sheet has these 12 data rows. Notes contains the business rules. Amounts are sales revenue in EUR; there is no cost or time-series data from which to calculate profit or growth.
| ID | Region | Amount in EUR |
|---|---|---|
| 00001 | East | 120 |
| 00002 | West | 80 |
| 00003 | East | 100 |
| 00004 | West | 150 |
| 00005 | East | 50 |
| 00006 | West | 200 |
| 00007 | East | 90 |
| 00008 | West | 110 |
| 00008 | West | 110 |
| 00009 | East | pending |
| 00010 | blank | 70 |
| 00011 | East | ”130” stored as text |
Keep the source unchanged. For your own data, give each row a clear meaning: an order, invoice, customer or line item. Two lines from the same order may be legitimate, so “remove duplicate IDs” can destroy valid revenue. Here the rule is narrower: remove only completely identical rows. Conflicting values for the same ID should be listed for review.
Only upload data you are allowed to process in the chosen service. Use a small anonymized copy when testing a new workflow. This example needs no customer names, credentials or confidential sales history.
Upload and define the result
Open Ofox Chat and start a new conversation. In the input area, choose the add control, then Upload local files (Japanese: 追加 → ローカルファイルをアップロード). Select the workbook and confirm its filename appears before sending. Uploading an attachment is not proof that every worksheet has been read.
Choose the language you want for the report in your instruction. The interface language can be selected in the account menu. In our run the mode label was バランス. We did not use an API key or build an integration for this browser workflow. Account access and usage conditions depend on the current product; this guide does not promise free or unlimited execution.
Use this reusable prompt. It is an English adaptation of the tested Japanese instructions, not a separate English benchmark:
Analyze the attached Excel workbook.
1. List all worksheets, the Sales row count excluding its header,
   column names, missing values and duplicates. Read the Notes sheet.
2. Preserve leading zeros in IDs. Remove only completely identical
   rows. Flag the same ID with different values for review.
3. Do not replace pending amounts with zero. Keep missing regions
   in an Unknown group. Log numeric text converted to numbers.
4. Report the cleaned record count, numeric record count, total,
   average with its denominator, and totals by region.
5. Produce a workbook containing cleaned data, a change log,
   regional summary and chart, plus a short report.
6. State unreadable data and unresolved questions. Provide downloads
   for files actually created; do not call unfinished files complete.
For a larger or unfamiliar workbook, split this into two turns. First request the inventory and proposed rules, review them, then authorize cleaning. For this small synthetic example, the Notes sheet specified the rules in advance, so a single instruction covered the sequence.
Check the cleaning before reading the conclusion
The observed response identified both worksheets, 12 input rows, one exact duplicate, one blank region and one pending amount. It logged the conversion of Sales!C13 from text 130 to numeric 130. It described retaining the first 00008 / West / 110 row and removing the identical second occurrence.
These are the checks to reproduce:
| Check | Expected result | Why it matters |
|---|---|---|
| Input data rows | 12 | Header is excluded |
| Exact duplicates removed | 1 | Only the identical 00008 row |
| Cleaned records | 11 | Pending record still exists |
| Records with known amounts | 10 | This is the average denominator |
| Unconfirmed amount records | 1 | Unknown does not become zero |
| Known revenue | EUR 1,100 | Excludes the pending amount |
| Mean known amount | EUR 110 | 1,100 divided by 10 |
Do not accept an average of 100 merely because it looks reasonable: that divides by all 11 cleaned records and silently treats the unknown amount as if it contributed nothing. Conversely, dropping the pending row entirely loses the record that still needs investigation.
IDs should remain text values such as 00001. A numeric cell displayed with a five-digit number format may look the same but behave differently when exported to another system. Check the actual value and type if those IDs will be matched against another file.
Reconcile the regional chart
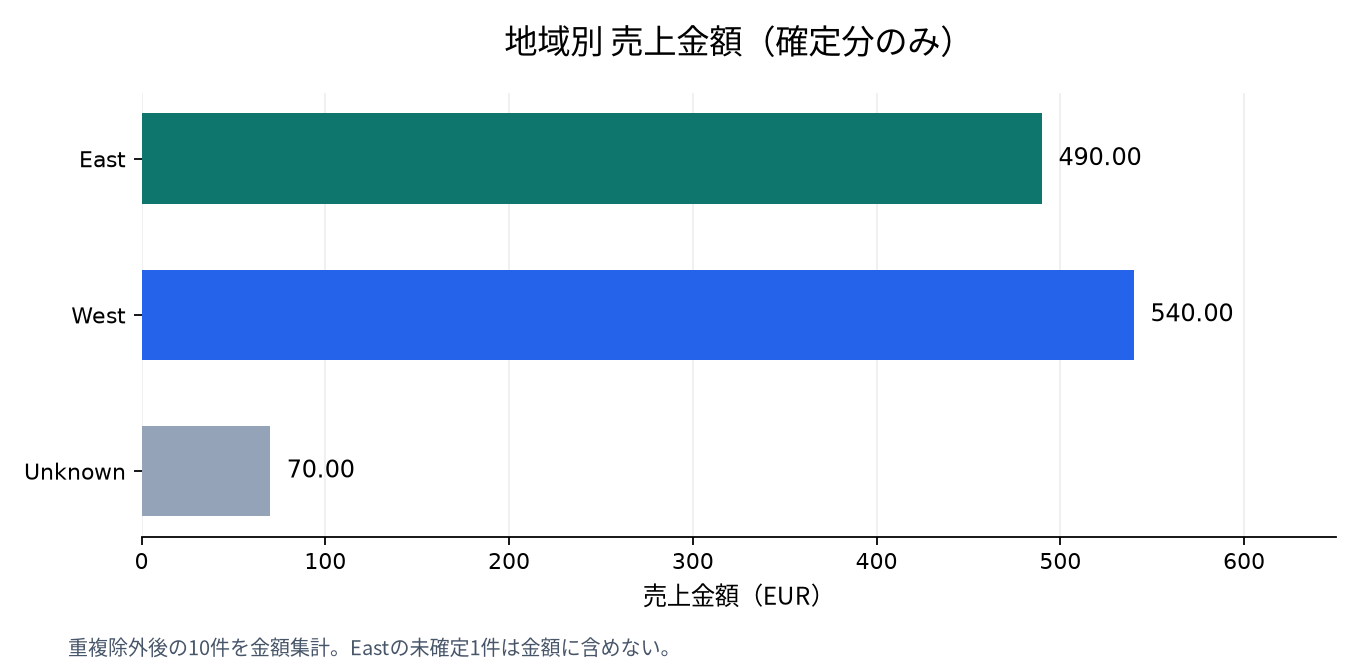
Our observed answer returned East 490, West 540 and Unknown 70. You can verify this without trusting the AI:
East:    120 + 100 + 50 + 90 + 130 = 490
West:     80 + 150 + 200 + 110      = 540
Unknown: 70
Total:   490 + 540 + 70            = 1,100
East has six cleaned records but only five known amounts. West has four; Unknown has one. If a chart excludes Unknown, it represents only EUR 1,030 and must say so. Otherwise its labels should reconcile to the EUR 1,100 headline total.
The useful conclusion is “West has the highest known revenue.” It is not “West is definitely the best region”: East still has an unconfirmed amount, and the source includes no margin, customer count, targets or prior period. The generated answer preserved this distinction.
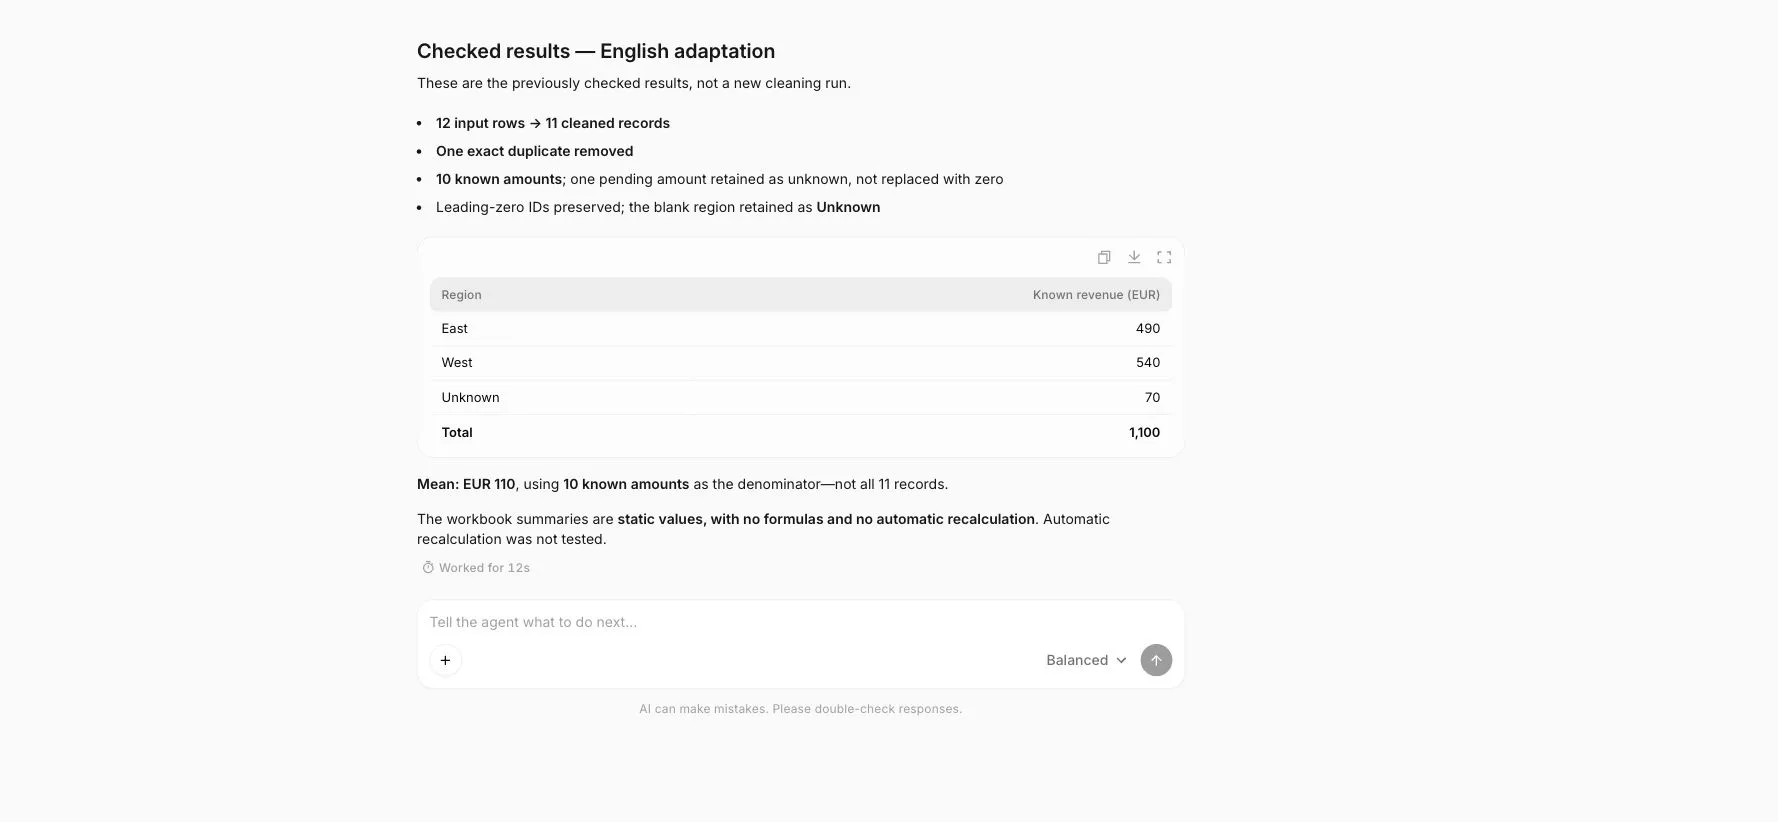
Actual Ofox Chat screenshot: English presentation of the same checked result, not a separate cleaning run. The screenshot is cropped to the response area.
Download and inspect the deliverables
The run produced cards for sales_cleaned.xlsx, regional_sales.png and sales_report.pdf. Use the download control beside each file. A file card proves that an output is offered; opening the downloaded file is a separate acceptance step.
We downloaded and inspected the outputs from this run. The workbook contained eight worksheets, preserved the five-digit IDs as text, and kept the amount for 00009 blank with an unconfirmed status. Its native chart used the three regional summary rows and excluded the grand-total row. The separate chart image and both pages of the PDF report rendered with readable labels and the expected totals. These checks did not include opening the workbook in desktop Excel or WPS.
Download the actual cleaned workbook, chart image and two-page report. These original outputs use Japanese labels; the English table above explains the same verified numbers.
For your own result, open the workbook and check the cleaned data, original data, change log and regional summary. Find 00009, confirm its amount is unconfirmed rather than zero, and locate the retained Unknown row. Compare the chart labels against the summary and make sure no graphic covers the underlying data. Check the report’s pages for missing text and unreadable labels, especially when using Japanese or Cyrillic fonts.
The exported workbook in this run contained static summary values and no formulas. Editing a source row will not automatically recalculate the regional summary. Its chart links to the summary cells, which is different from recalculating those cells from the source data. Treat this file as a checked snapshot.
For recurring reporting, explicitly request formulas or a refreshable transformation and ask which inputs drive each result. Then change one amount in a copy, verify the expected change in both the summary and chart, and restore the test value. Do not call the workbook reusable until that check passes.
What to do when the result is wrong
| Symptom | Next instruction or check |
|---|---|
| Too few rows | Ask for every sheet name, data range and excluded-row reason; compare with the source |
| Total too high | Check exact duplicates and whether subtotal rows were counted again |
| IDs lose zeros | Request text-preserving import and inspect the saved cell values |
| Average is unexpectedly low | Ask for the numeric record count and whether unknowns became zero |
| A region disappears | Preserve blank categories as Unknown and reconcile category totals |
| Agent says a file is ready but no download exists | Ask it to list actual created filenames and attach the files; don’t accept code alone as delivery |
| A correction changes other numbers | Request a before/after change log and rerun the original total checks |
A targeted correction is more useful than “try again.” For example: “The output has no Unknown category, but source ID 00010 contains 70 EUR. Keep that row, rebuild the regional chart, and show the revised category totals.” Retain the original failed result so you can tell whether the correction actually fixed the issue.
For merged-cell forms, macros, protected sheets and linked workbooks, test a copy separately. This tutorial did not establish that those features survive editing. If the task only needs a summary, request a new analysis workbook instead of allowing broad changes to your operational template.
Use the checked output for the next task
Start your own analysis in Ofox Chat with one workbook and an explicit definition of a valid row. Once the totals reconcile, the report can become an input for a presentation or a recurring reporting workflow. If the evidence starts in several documents, first use the multiple-PDF summary workflow to preserve sources and unresolved differences. For model-specific document, slide and spreadsheet prompting examples, see the Sonnet task-prompt guide.
Related Docs
For a later move from this browser task to a programmatic workflow, consult the Ofox API documentation. API setup is separate from the Chat steps demonstrated here.