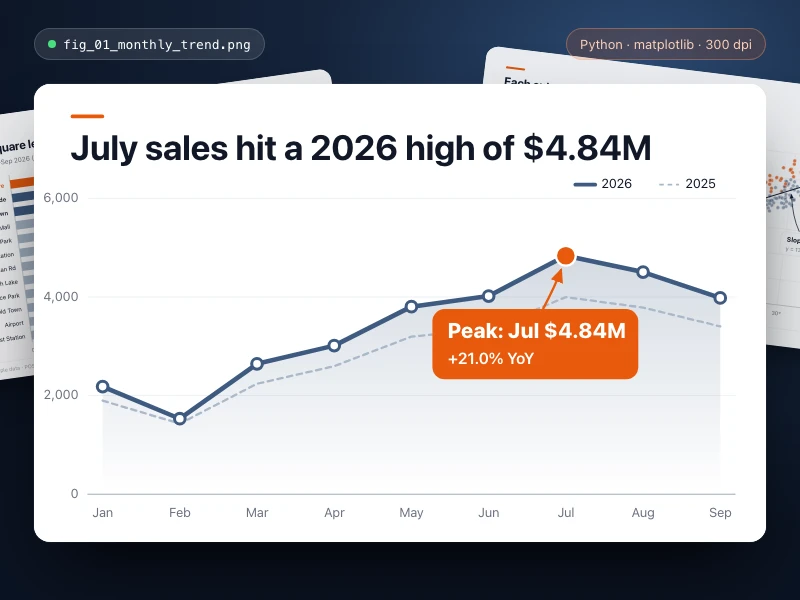
Data chart
Turn data into a publication-quality chart with Python: full titles, axes and legend, key points highlighted, exported as high-res PNG / SVG for your report.
提示詞
Make a line chart of my monthly store sales for our quarterly review: show this year's trend against the same months last year, mark the highest and lowest points, and use a title that states the takeaway. Colors: clean blue-gray with orange for highlights, with axis units and a legend. Export a high-resolution PNG and an SVG.
- 來源
- Ofox
如何使用
- 1
點擊「做同款」
進入 Ofox Chat,這個需求已經替你寫好。未登入時請先登入。
- 2
改成你想要的
提示詞裡高亮的部分可以直接改,換成你自己的內容。
- 3
送出並生成
傳送後 Ofox Chat 撰寫程式碼並執行驗證,完成後可以預覽或下載;不滿意可以繼續對話修改。
常見問題
做出來的是什麼?
一個可以直接開啟的網頁。Ofox Chat 寫好程式碼後會在沙箱裡執行驗證,結果可以在對話裡預覽,程式碼檔案可以下載。
需要會寫程式嗎?
不需要。用平常的話說清楚要做什麼,需要處理檔案就一併上傳;程式碼由 Ofox Chat 來寫和執行。
可以修改提示詞嗎?
可以。提示詞會填進 Ofox Chat 的輸入框,傳送前可以換成你自己的主題、補充要求,或刪掉不需要的部分。
提示詞可以直接複製使用嗎?
可以。點提示詞卡片右上角的「複製」即可取得純文字,也能用在其他 AI 程式設計工具裡。
更多同類
更多數據提示詞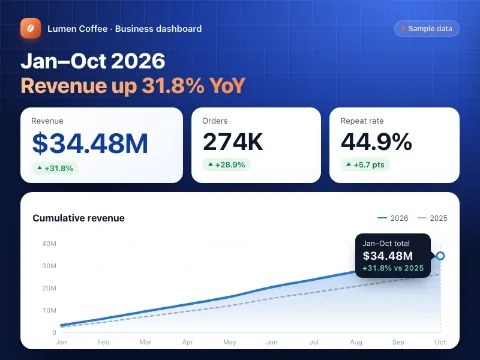

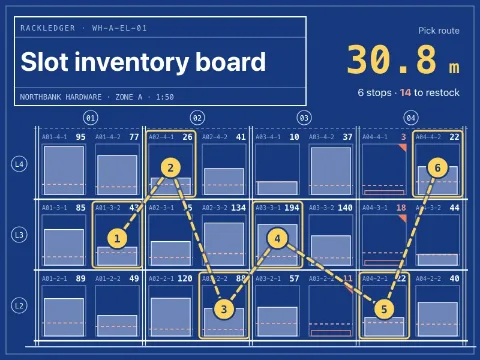
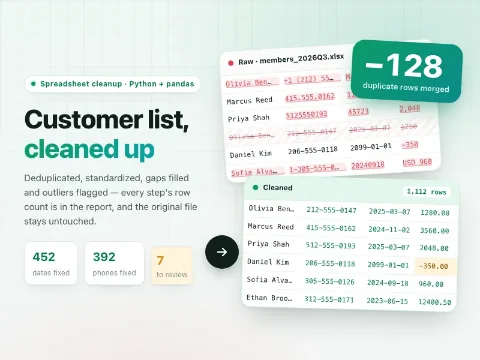





有自己的想法?直接開始創作
在 Ofox Chat 裡用一句話描述你想要的畫面,從零生成屬於你的作品。