Gamma alternatives for PowerPoint: what stays editable?
Compare Gamma, Plus AI, Ofox, Claude and Genspark for PowerPoint handoffs. Inspect real exports, native tables, chart data and a slide-only revision test.
 Ofox

If your team finishes presentations in PowerPoint, choose a Gamma alternative by what survives export: text boxes, table cells, chart data and the ability to revise one slide without changing the rest. Plus AI is a candidate for working inside PowerPoint; Ofox and Claude are candidates for generating files from instructions; Genspark is a candidate for a broader research-and-slide workspace. Staying with Gamma can still be the right choice when its web editor is your main working environment.
We ran the same small synthetic presentation task in Gamma and Ofox on November 5, 2026. Both exported a native table. In this particular test, Ofox also delivered a native PowerPoint chart with an embedded workbook; Gamma’s exported chart was an image. Both preserved slides 1 and 2 when asked to revise slide 3. These are findings from two small runs, not a ranking of overall quality or reliability.
Ofox publishes this comparison. The Plus AI, Claude and Genspark sections below describe official documentation, not hands-on results. Our tests used English interfaces, Gamma Free with Standard mode and Ofox Balanced mode. Those UI labels do not identify fixed underlying model versions. We did not benchmark speed, price, complex corporate templates or desktop PowerPoint compatibility.
First decide what “editable” must mean
A PowerPoint extension alone tells you little about the contents. A slide can be a single image inside a valid .pptx file. It may look right while leaving your colleague unable to change one number.
| Required change | What the file needs | What is insufficient |
|---|---|---|
| Rewrite a heading | A text object | Text baked into an image |
| Change one table cell | A native table, or explicitly acceptable separate text objects | A screenshot of a table |
| Change May from 150 to 160 and redraw bars | A chart with editable data | A picture of bars; separately movable shapes without chart data |
| Apply company styling | Compatible layouts, fonts and theme behavior | A visually similar screenshot |
| Update a single risk | A scoped edit that preserves unrelated content | Regeneration that silently changes figures or other slides |
If you update charts regularly, the third row may decide the choice. A chart can be editable in the original web app yet arrive in PowerPoint as an image. Conversely, native objects do not guarantee that fonts, spacing or master slides behave exactly as your company expects. File structure and visual compatibility require separate checks.
What Gamma already does
Do not switch merely because someone says Gamma cannot export editable tables. Its current export documentation says editable PowerPoint tables are enabled by default and available on all plans. Our Free-account export contained a native table with April 120, May 150, June 135 and total 405.
In Gamma, open Share → Export → Export to PowerPoint. Check Editable tables before downloading. The export panel also identifies fonts needed for the presentation and warns that some visual effects use fallback styles. Free exports retain the Gamma badge; do not assume the ability to download means unbranded output.
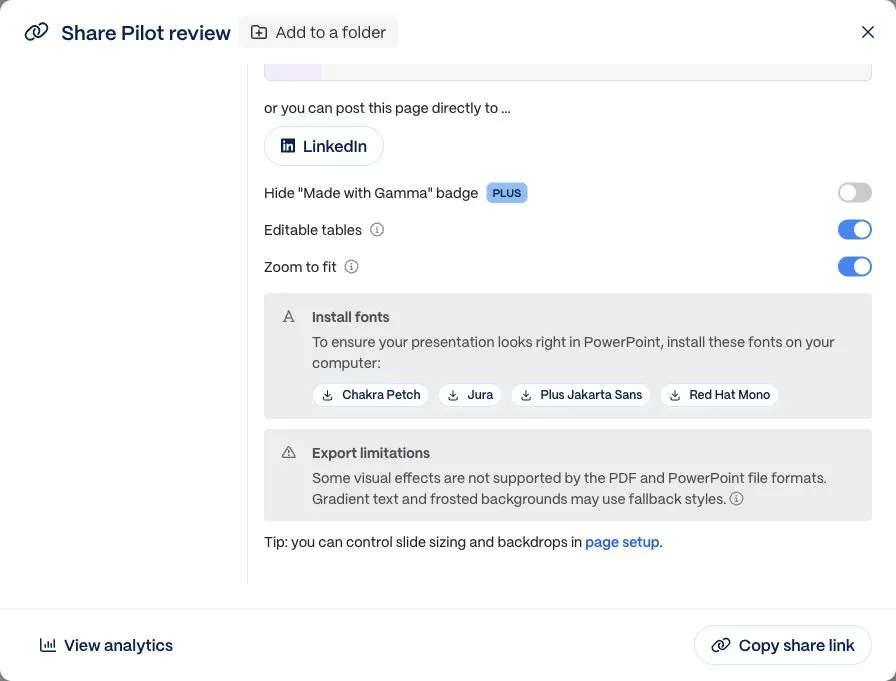
Real Gamma export settings, November 5, 2026. Cropped to the panel for readability. The setting concerns tables; it does not establish native chart-data export.
Keep Gamma if the team edits and presents there, accepts its export characteristics, and values its visual workflow. If only one chart needs monthly updates, rebuilding that chart in PowerPoint may be less disruptive than moving the entire workflow. Our observed chart result is a reason to inspect your export, not evidence that every Gamma chart or export mode behaves identically.
Four alternatives, chosen by the handoff
| Alternative | Best reason to consider it | Evidence here | Boundary to check |
|---|---|---|---|
| Plus AI | Generate and revise presentations inside PowerPoint or Google Slides | Official product and workflow documentation | Test your actual template and chart types in the target application |
| Ofox Chat | Ask for a downloadable deck with specified native objects and a controlled follow-up edit | Downloaded three-slide PPTX and revision | Small synthetic example; no complex master-slide or desktop compatibility test |
| Claude | Create a presentation alongside documents, spreadsheets or other files | Official file-creation documentation | File creation must be enabled; inspect the actual generated objects |
| Genspark | Combine research, slide creation and a shared file workspace | Official Slides and export documentation | Paid export entitlement and complex object conversion |
Plus AI: Its PowerPoint product page emphasizes native editable presentations. The web workflow guide distinguishes downloading a PPTX from using the add-in in PowerPoint or Google Slides. If colleagues already maintain a corporate deck in Office, working in that environment can reduce the number of handoffs. That is a workflow advantage, not a result we measured. When importing an existing deck, distinguish preservation from an AI remix: the import guide explains rewriting and remixing options. That file-upload workflow requires Pro or Team and does not extract images, diagrams or charts from the source. Do not confuse importing source content with preserving all existing objects. Test a copy before applying it to an approved deck.
Ofox Chat: Use it when the deliverable is a file with explicit requirements: “three slides, native table, native chart, do not change the source figures.” In our run, the downloaded file met those structural requirements. The useful advantage was inspectable output and a precise revision, rather than an assumption that every generated slide will be publication-ready. A related PDF-to-editable-PPT workflow covers extracting a deck from source documents; this comparison starts from a short brief.
Claude: The official file-creation guide describes creating and editing PowerPoint, Excel, Word and PDF files. It is a candidate when the presentation is one part of a larger analytical task. Availability depends on the enabled file-creation environment and workspace controls. We did not run this brief in Claude, so the documentation is not proof of native chart output, template fidelity or revision behavior for this sample.
Genspark: Its AI Slides guide describes Professional and Creative modes, guided creation and export to PowerPoint, PDF and Google Slides. Export requires an eligible paid plan. The Slides FAQ cautions that complex HTML tables and charts can become images or shapes in PowerPoint. That makes it a plausible workspace alternative, but not an automatic solution to native chart editing. Confirm the exact objects in your export before switching for that reason.
The same-brief export test
We submitted this exact English input to Gamma and Ofox:
Create a downloadable 3-slide PowerPoint in English using only this
synthetic data. Slide 1: Pilot review, decision pending. Slide 2: a native
editable table and native chart with April 120, May 150, June 135 completed
orders; total 405. Slide 3: risks and next action: July target not approved;
do not invent a target. Keep text editable and include the source label
Synthetic pilot brief on each slide. Do not browse the web.
Gamma produced an outline, then generated and polished the slides after we selected Generate. We exported the finished version using Standard quality with Editable tables enabled. Ofox returned a downloadable PPTX. We inspected both actual files rather than treating the agents’ completion messages as verification.
| Check | Gamma final export | Ofox output |
|---|---|---|
| Three slides | Yes | Yes |
| Monthly values and total 405 | Preserved | Preserved |
| Source label on every slide | Present | Present |
| July target left unapproved | Yes | Yes |
| Native PowerPoint table | Present | Present |
| Native chart and embedded data workbook | Not present; chart exported as an image | Present; values 120, 150, 135 |
| Editable text objects | Present | Present |
Download the Gamma final export and Ofox original output. Both use synthetic data. Gamma’s template adds visual design and explanatory prose; the files are not layout-matched. We therefore do not treat file size or generation time as a fair performance comparison.
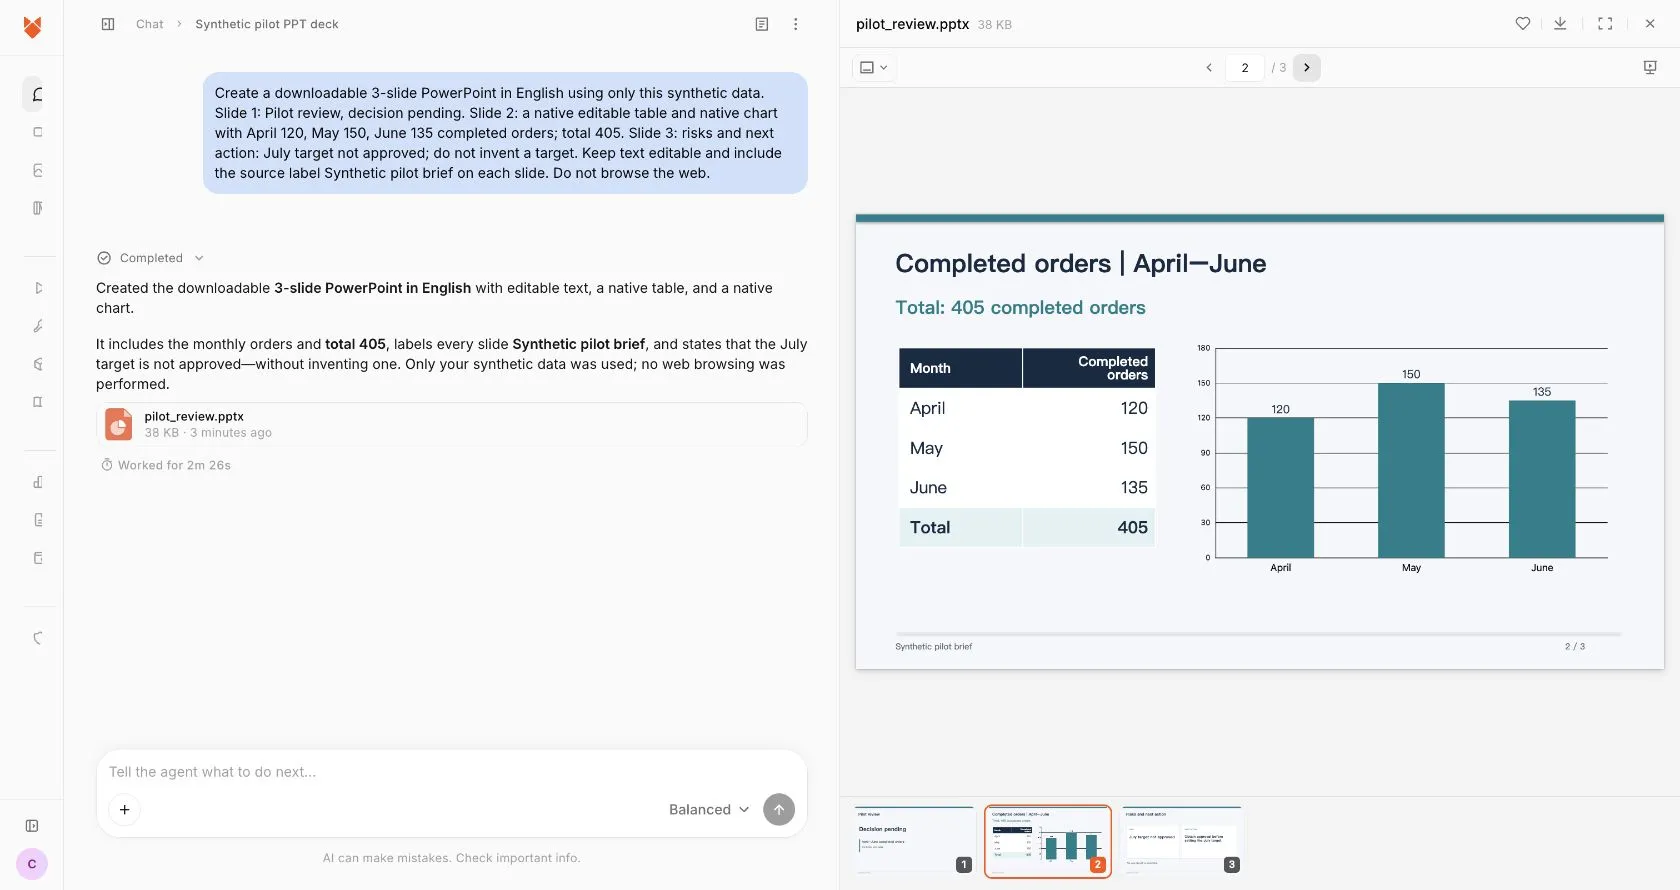
Actual Ofox preview. Native-object findings come from the downloaded PPTX, not from this screenshot.
A second test: change only the risk
We then asked both tools to replace slide 3’s risk wording with “July target awaiting management approval”, keeping the next action, all data, chart, table and slides 1–2 unchanged. Ofox was additionally asked to return a new filename.
The Ofox package changed only slide3.xml, with one risk-text replacement. The Gamma revision also left the first two slide XML files unchanged; slide 3 changed its risk heading and explanatory paragraph, while its next-action text remained unchanged. Its package metadata also changed. Gamma’s interface displayed an original/modified comparison for the affected slide.
Download the Ofox revision and Gamma revision. These results show that both tools handled this scoped edit. They do not establish that either will preserve every unrelated object in a larger, more complex presentation.
How to choose without moving everything at once
Start with one representative deck containing the object that causes the most rework: a recurring chart, a financial table or a slide tied to an approved source. Keep the original source data and an untouched export. Run the same brief in the candidate tool and name each output by tool and version.
Open the downloaded file in the application your colleague will actually use. Change a title, a table cell and a chart value. A successful test means the relevant object changes correctly and the result survives saving and reopening. Also check fonts, clipping, slide size, notes and the company template. Our package inspection cannot substitute for this application-specific step.
If the chart arrives as an image, choose among three concrete repairs: retain editing in the original web tool; recreate that chart natively from the source data; or use a generation route that demonstrably provides native chart data. Asking for “more editable” without naming the failed object is unlikely to resolve the requirement.
If a revision changes unrelated slides, revert to the saved original, identify the exact slide and text, and request only that replacement. Compare the newly downloaded file rather than relying on a statement that nothing else changed. For visually complex decks, a slide-by-slide review remains necessary even when numerical values are intact.
Use Ofox Chat with the supplied brief if a file-first workflow fits your work. Choose Plus AI for an Office-centered evaluation, Claude for broader file authoring, Genspark for its integrated workspace, or keep Gamma when its editor and export already meet the handoff. The deciding result is what the next person can safely change.
Related Docs
Ofox API documentation covers programmatic use separately from the browser-based Chat workflow tested here.